Thursday was another mild day of crowds across Walt Disney World, with all four parks’ posted wait times near their 30-day low averages. There’s usually a lull right before a very busy period, and that’s exactly what we saw today. Enjoy these low wait times because things are about to get busy this Halloween weekend.
Also, we counted 483 of 500 people (97%) in EPCOT’s World Showcase yesterday wearing their masks in full compliance with Disney’s guidelines. Okay, let’s do the numbers.
Magic Kingdom Wait Times
Here’s something you don’t see every day: We received 5 actual wait times today at Seven Dwarfs Mine Train, and the actual wait averaged 103% of the posted wait time (it’s usually much lower than that – the park averaged 80% overall today). 7DMT had an average posted wait time today of 42 minutes, 12 lower than its 7-day average of 54 minutes, so today ranks #4 for this week. Its 30-day average is 60 minutes, so today ranks #27 for the past month.
Splash Mountain had an average posted wait time today of 39 minutes. Its 7-day average is 55 minutes, so today ranks #5 for this week. Its 30-day average is 62 minutes, so today ranks #28 for the past month. We received 6 actual wait times today, and the actual wait averaged 91% of the posted wait time.

As you can see, weekdays are the way to go. If you’ve got to visit during a busy weekend, have a special tool at your side. Subscribe today and get our Lines app too.
Big Thunder Mountain Railroad had an average wait time today of 26 minutes, 20 under its 7-day average of 46 minutes, so today ranks #6 for this week. Its 30-day average is 44 minutes, so today ranks #29 for the past month. We received 9 actual wait times today, and the actual wait averaged 72% of the posted wait time.
It was a nice leisurely day at Jungle Cruise had an average wait time today of 26 minutes, 10 less than its 7-day average of 36 minutes, so today ranks #6 for this week. Its 30-day average is 41 minutes, so today ranks #29 for the past month. We received 4 actual wait times today at Jungle Cruise, and the actual wait averaged 56% of the posted wait time.
As spooky season begins to wind down, The Haunted Mansion had an average wait time today of 33 minutes. Its 7-day average is 43 minutes, so today ranks #4 for this week. Its 30-day average is 44 minutes, so today ranks #26 for the past month. We received 4 actual wait times today, and the actual wait averaged 57% of the posted wait time.
Peter Pan’s Flight had an average wait time today of 23 minutes. Its 7-day average is 32 minutes, so today ranks #5 for this week. Its 30-day average is 34 minutes, so today ranks #28 for the past month. We received 4 actual wait times today, and the actual wait averaged 78% of the posted wait time.
Pirates of the Caribbean had an average wait time today of 30 minutes. Its 7-day average is 42 minutes, so today ranks #5 for this week. Its 30-day average is 48 minutes, so today ranks #28 for the past month. We received 5 actual wait times today, and the actual wait averaged 82% of the posted wait time.
EPCOT Wait Times
Soarin’ had an average posted wait time today of 10 minutes. Its 7-day average is 33 minutes, so today ranks #6 for this week. Its 30-day average is 36 minutes, so today ranks #29 for the past month. We received 4 actual wait times today, and the actual wait averaged 147% of the posted wait time (holy cow!), which is not good.
Test Track had an average wait time today of 39 minutes. Its 7-day average is 59 minutes, so today ranks #5 for this week. Its 30-day average is 62 minutes, so today ranks #28 for the past month. We received 7 actual wait times today, and the actual wait averaged 46% of the posted wait time. I mean, if you average out the actual percentages for Soarin’ and Test Track together, you get close to 100%? Just looking for something positive to take out of those two numbers.
Spaceship Earth had an average wait time today of 11 minutes. Its 7-day average is 17 minutes, so today ranks #3 for this week. Its 30-day average is 19 minutes, so today ranks #24 for the past month.
Frozen Ever After had an average wait time today of 47 minutes. Its 7-day average is 58 minutes, so today ranks #4 for this week. Its 30-day average is 63 minutes, so today ranks #27 for the past month.
And Journey Into Imagination With Figment had an average wait time today of 7 minutes, half of its 7-day average of 14 minutes; today ranks #5 for this week. Its 30-day average is 15 minutes, so today ranks #25 for the past month.

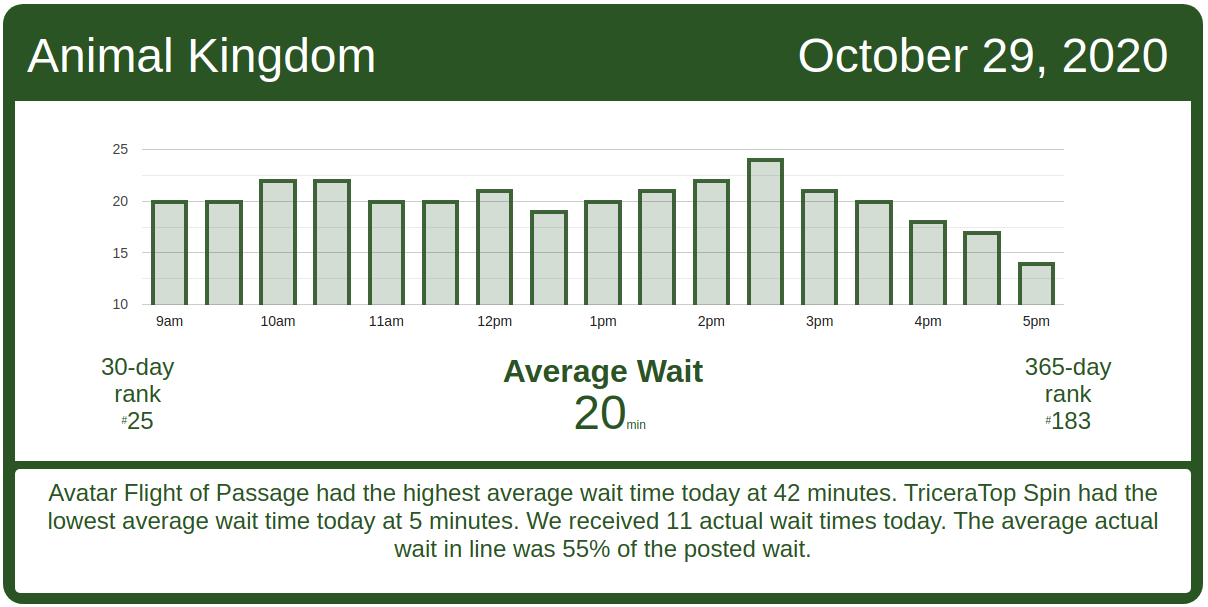
Animal Kingdom Wait Times
I’m starting with It’s Tough to Be a Bug because we never do that, and it reminds me of Heimlich’s Chew Chew Train. It’s Tough to Be a Bug! had an average wait time today of 12 minutes. Its 7-day average is 15 minutes, so today ranks #3 for this week. Its 30-day average is 15 minutes, so today ranks #18 for the past month.
DINOSAUR had an average wait time today of 15 minutes, 13 below its 7-day average of 28 minutes, so today ranks #4 for this week. Its 30-day average is 31 minutes, so today ranks #25 for the past month. TriceraTop Spin had an average wait time today of 5 minutes. Its 7-day average is 6 minutes, so today ranks #2 for this week. Its 30-day average is 6 minutes, so today ranks #7 for the past month.
Na’vi River Journey had an average wait time today of 40 minutes (#3 week / #21 month / #168 year). And Avatar Flight of Passage had an average wait time today of 42 minutes (#4 week / #24 month / #175 year).
Hollywood Studios Wait Times
Rock ‘n’ Roller Coaster had an average wait time today of 38 minutes. Its 7-day average is 49 minutes, so today ranks #6 for this week. Its 30-day average is 52 minutes, so today ranks #28 for the past month. We received 4 actual wait times today, and the actual wait averaged 91% of the posted wait time. Next door, Tower of Terror had an average wait time today of 36 minutes. Its 7-day average is 42 minutes, so today ranks #5 for this week. Its 30-day average is 49 minutes, so today ranks #27 for the past month. We received 4 actual wait times today, and the actual wait averaged 92% of the posted wait time.
In Toy Story Land:
- Toy Story Mania had an average wait time today of 23 minutes. Its 7-day average is 28 minutes, so today ranks #6 for this week. Its 30-day average is 30 minutes, so today ranks #29 for the past month. We received 11 actual wait times today, and the actual wait averaged 37% of the posted wait time (!).
- Slinky Dog Dash had an average wait time today of 50 minutes. Its 7-day average is 62 minutes, so today ranks #6 for this week. Its 30-day average is 68 minutes, so today ranks #28 for the past month.
- Alien Swirling Saucers had an average wait time today of 18 minutes. Its 7-day average is 22 minutes, so today ranks #4 for this week. Its 30-day average is 25 minutes, so today ranks #26 for the past month.
Mickey & Minnie’s Runaway Railway had an average wait time today of 61 minutes, 15 fewer than its 7-day average of 76 minutes (#6 week / #29 month). We received 4 actual wait times today, and the actual wait averaged 91% of the posted wait time.
Millennium Falcon: Smugglers Run had an average wait time today of 43 minutes. Its 7-day average is 56 minutes, so today ranks #6 for this week. Its 30-day average is 59 minutes, so today ranks #29 for the past month. We received 5 actual wait times today at Falcon, and the actual wait averaged 105% of the posted wait time.

Rise of the Resistance ran really well today – it looks like they’re ramping up capacity, which is a good sign that more people will be able to ride Disney World’s best ride soon.

The post Mild Crowds Again! – Walt Disney World Wait Times for Thursday, October 29, 2020 appeared first on TouringPlans.com Blog.
From our friends at touringplans.com
Filed Under: Trip Planning, Walt Disney World (FL), disney crowds, disney wait times, walt disney world wait times