Posted wait times throughout Walt Disney World were near their monthly lows today. Even with a bit of afternoon rain, it was a great day to visit the parks. Weekdays are much better than weekends right now. Let’s do the numbers.
Magic Kingdom Wait Times
Seven Dwarfs Mine Train had an average posted wait time today of 41 minutes. That’s 17 minutes below its 7-day average of 58 minutes, so today is the 2nd slowest day of the week. 7DMT’s 30-day average is 60 minutes and today ranks #29 for the past month. We received 6 actual wait times today at Mine Train, and the actual wait averaged 63% of the posted wait time.
Splash Mountain had an average wait time today of 41 minutes, and actual wait times averaged almost half – 54% – of the posted wait. Splash’s 7-day average is 58 minutes, so today ranks #6 for this week; it’s also #29 for the past month.

A bunch of other rides had posted waits very close to their monthly lows, including these:
- Haunted Mansion’s average wait time today was 31 minutes. Its 7-day average is 46 minutes, so today ranks #6 for this week. Its 30-day average is 45 minutes, so today ranks #28 for the last month.
- Peter Pan’s Flight average wait was 23 minutes. Its 7-day average is 33 minutes, so today ranks #6 for this week. Its 30-day average is 35 minutes, so today ranks #29 for the past month.
- Jungle Cruise had an average wait time today of 31 minutes – that’s #5 for the week, #28 for the month, and #193 for the past year. We received 4 actual wait times today for Jungle Cruise, and the actual wait averaged 74% of the posted wait time.
- Pirates of the Caribbean average wait was 33 minutes. Its 7-day average is 45 minutes, so today ranks #6 for this week. Its 30-day average is 49 minutes, so today ranks #29 for the past month.
- Space Mountain had an average wait time today of 17 minutes. Its 7-day average is 39 minutes, so today ranks #6 for this week. Its 30-day average is 43 minutes, so today ranks #29 for the past month.
- Buzz Lightyear’s Space Ranger Spin had an average wait time today of 17 minutes. Its 7-day average is 32 minutes, so today ranks #6 for this week. Its 30-day average is 31 minutes, so today ranks #29 for the past month.
Big Thunder Mountain Railroad had the highest average posted waits today at 45 minutes. Its 7-day average is 46 minutes, so that makes today #2 for this week. Its 30-day average is 45 minutes, so today ranks #14 for the past month.
As you can see, weekdays are the way to go. If you’ve got to visit during a busy weekend, have a special tool at your side. Subscribe today and get our Lines app too.
Hollywood Studios Wait Times
Star Tours: The Adventures Continue had an average wait time today of 22 minutes, but even that might be inflated: We received 4 actual wait times today, and the actual wait averaged 44% of the posted wait time. Even so, 22 minutes is well below Star Tours’ 7-day average of 32 minutes, so today ranks #6 for this week. Its 30-day average is 29 minutes, so today ranks #28 for the past month. Its 365-day average is 27 minutes, so today ranks #143 for the past year.
Mickey & Minnie’s Runaway Railway had an average wait time today of 71 minutes. Its 7-day average is 84 minutes, so today ranks #6 for this week. Its 30-day average is 84 minutes, so today ranks #28 for the past month.
Over in Toy Story Land, Slinky Dog Dash had an average wait time today of 59 minutes. Its 7-day average is 68 minutes, so today ranks #6 for this week. Its 30-day average is 69 minutes, so today ranks #26 for the past month. And Toy Story Mania had an average wait time today of 23 minutes. Its 7-day average is 30 minutes, so today ranks #6 for this week. Its 30-day average is 31 minutes, so today ranks #29 for the past month.

In Galaxy’s Edge, Millennium Falcon: Smugglers Run had an average wait time today of 47 minutes. Its 7-day average is 62 minutes, so today ranks #6 for this week. Its 30-day average is 61 minutes, so today ranks #28 for the past month.
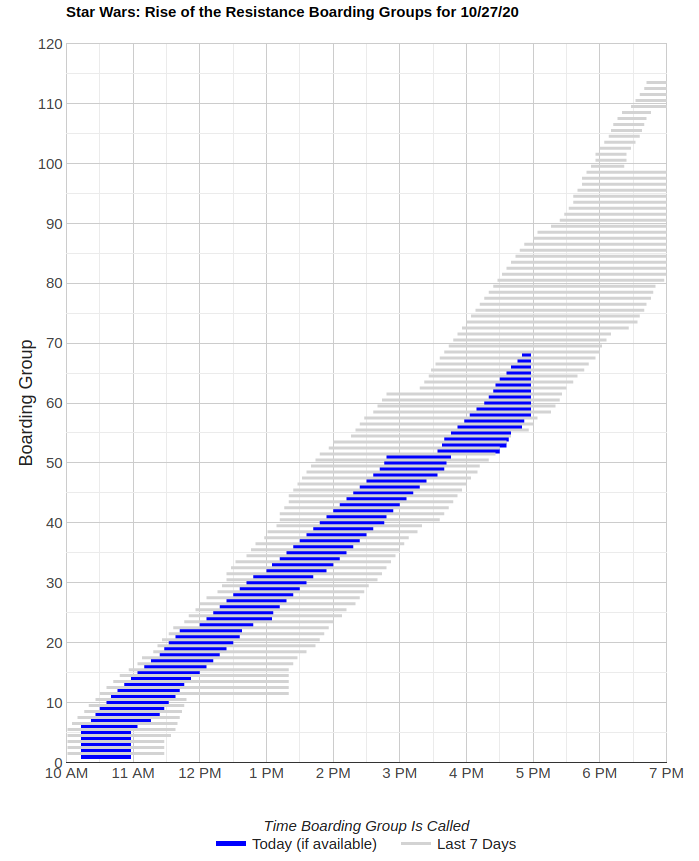
Rise of the Resistance boarding groups went well through the late morning and into the early afternoon. It looks like there was a delay of about 45 minutes around 2:45 p.m. today around Boarding Group 51, and then things got back on track around 3:30 p.m.
EPCOT Wait Times
The (relatively low crowd trend continued at EPCOT today. Frozen Ever After had an average wait time today of 49 minutes. Its 7-day average is 62 minutes, so today ranks #5 for this week. Its 30-day average is 63 minutes, putting today at #26 for the past month.
Living with the Land had an average wait time today of 12 minutes. Its 7-day average is 13 minutes, so today ranks #4 for this week. Its 30-day average is 13 minutes, so today ranks #18 for the past month. And Soarin’ had an average wait time today of 16 minutes, 20 minutes lower than its 7-day average. Today ranks #6 for this week. Its 30-day average is 36 minutes, so today ranks #28 for the past month. We received 5 actual wait times today, and the actual wait averaged 67% of the posted wait time.

Journey Into Imagination With Figment had an average wait time today of 6 minutes. Its 7-day average is 16 minutes, so today ranks #5 for this week.
Spaceship Earth had an average wait time today of 10 minutes. Its 7-day average is 18 minutes, so today ranks #5 for this week. Its 30-day average is 18 minutes, so today ranks #24 for the past month. And Test Track had an average wait time today of 47 minutes (#5 week / #23 month / #128 year).
Finally, The Seas with Nemo & Friends had an average wait time today of 7 minutes. Its 7-day average is 12 minutes, so today ranks #5 for this week. Its 30-day average is 12 minutes, so today ranks #28 for the past month.
Animal Kingdom Wait Times
Let’s start where it all began: Africa. Kilimanjaro Safaris average posted wait today was 15 minutes. That’s below its 7-day average of 21 minutes, so today ranks #6 for this week. Its 30-day average is 21 minutes, so today ranks #25 for the past month. Its 365-day average is 51 minutes, so today ranks #199 for the past year – a slow day at the Safaris.
Over in Asia, Expedition Everest had an average wait time today of 15 minutes. Its 7-day average is 34 minutes, so today ranks #6 for this week. Its 30-day average is 31 minutes, so today ranks #26 for the past month. And Kali River Rapids had an average wait time today of 13 minutes (#4 week / #25 month).
In Pandora, Na’vi River Journey had an average wait time today of 35 minutes. Its 7-day average is 49 minutes, so today ranks #6 for this week. Its 30-day average is 46 minutes, so today ranks #26 for the past month. Its 365-day average is 61 minutes, so today ranks #185 for the past year.
Finally, Avatar Flight of Passage had an average wait time today of 28 minutes. Its 7-day average is 64 minutes, so today ranks #6 for this week. Its 30-day average is 62 minutes, so today ranks #27 for the past month. Its 365-day average is 103 minutes, so today ranks #192 for the past year.

The post Today’s Crowds Lowest of Past Month – Walt Disney World Wait Times for Tuesday, October 27, 2020 appeared first on TouringPlans.com Blog.
From our friends at touringplans.com
Filed Under: Trip Planning, Walt Disney World (FL), disney crowds, disney reopening, disney wait times